Integrating Media Literacy into Gr 10 English through Multi-Media
Feb. 9
I chose coronavirus as the central theme of the first weeks’ language studies for 2 grade 10 classes of adult (22+) learners at Scarborough Centre for Alternative Studies. I chose coronavirus because I wanted content that would be engaging, relevant, multi-media and meaningful, but also because it would be evolving as we worked and would implicate multi-media study and research.
I imagined that the students would help me brainstorm a variety of tasks and then choose a subset of those tasks that would demonstrate their learning. I wanted the tasks to include descriptive, persuasive and personal writing as well as graphic and oral production.
I imagined possible topics such as timelines, historical background (e.g., 1917 flu, SARS) to explain global concerns, testimonials, infographics, Q&A lists, prevention and care tipsheets, responses to the epidemic by governments, WHO, cruise industry, airline industry, fakenews, representations of the disease in various social media, racial prejudices, etc. I also hope that they might describe some of their metacognitive processes as they complete the study, but that might be too ambitious for grade 10 English.
I hope that the areas for research and the products will be generated by the students. I also hope that I will find multiple opportunities for media literacy learning. In any case, I hope that the tasks will be their choices.
Feb. 10
Attendees at an Ontario Teachers Federation workshop were told that a major factor in successful reading/learning at secondary level was the quality of prior knowledge. Because they know more, students can better make connections to new knowledge.
As such, I will begin the coronavirus unit with an inventory of their prior knowledge to determine what students already know about flu, viruses and the coronavirus.
I plan to begin the unit with a general discussion of coronavirus, documenting what students know. Then we will move to big questions and personal concerns. “I wonder…” “I hope…” “What if…” “How can I…” “What support can I access…” “Should I wear a mask?” “…gloves?” “Should I avoid school, restaurants, public transit, place of worship, the mall?”
There are several organizations producing coronavirus-focused YouTube videos. One of these—Medcram— provides daily updates. I thought that we might watch and discuss one or two of these to build our prior knowledge and to assess the qualities of the videos.
We can discuss the speaker’s tone, the hand-written words, the effects of different coloured words, etc.
(E.g., Coronavirus Epidemic Update 14: Hospital spread of infection, WHO allowed in China, N-95 masks)
Feb. 11
Prior to the coronavirus unit, I had asked students to create and explain signs that they thought should exist. I called the task, There Ought to be a Sign for That! (Download here.)
Students presented the signs that they had designed and then wrote paragraphs describing their signs’ purposes and visual design strengths.
This task was a good warm-up for an exploration of the iconography and news reports arising from the coronavirus epidemic.
Al Jazeerah
Feb. 12
I started the unit by explaining why we were studying coronavirus rather than a short story or poem. I explained that the precise content was irrelevant as long as students exercised and developed English-appropriate thinking and communication skills. They were OK with that.
I also explained that we were building their prior knowledge because that would help them understand and remember the information that they learned. They were OK with that.
We began by building a Google doc that recorded what they already knew about Covid-19 (its name had just been changed from ‘coronavirus’ that day), then added what they wanted to know.
I prompted with sentence starters like, ‘I wonder….’ ‘How do….’ etc.
They enjoyed the conversation and were very engaged.
There were lots of questions suggested.
We also discussed related terminology: vaccination, bacteria vs. virus, anti-biotic, incubation, etc.
We included science, e.g., why people run temperatures, lose their appetites, etc.
We included math, e.g., what percentage of the Chinese population has contracted Covid-19. We searched for the the population of China and the number of reported cases as of that date, then calculated that 0.08% of the population had reported contracting the disease. This calculation helped us achieve some perspective on the size of the epidemic.
We included math/business, e.g., the economic impact on the airline industry of cancelled Chinese flights, cancelled orders, etc. We imagined a daily Air Canada flight from Toronto to Beijing with 298 people at a cost of $1000 per person equaling $298,000 per day in lost revenue.
The students were anxious about what kinds of assignments might arise from these discussions. I explained that they would be the usual collection of English assignments, e.g., descriptive writing, personal writing, persuasive writing, and infographics; that we would negotiate what assignments they would do and I would provide criteria. They relaxed.

The Top 10 News
Feb. 13
Last day before a 4-day break, so I wanted students to feel comfortable with the directions we were taking.
We watched a Medcram medical update on YouTube to build their prior knowledge of Covid-19. I slowed the video to 0.75 speed, explaining that the video narrator was speaking US English, which none of us spoke. Because our English dialects are different and diverse (Middle Eastern, Eastern European, African, Caribbean and Canadian), the slower speed helps us understand that narration.
I paused the video to talk about its use of different-coloured lettering and images to help viewers understand that some cells were human and some were virus. I paused a second time when the doctor teased the viewers with an immune-boosting strategy that was ‘1. Not a drug, 2. Free and 3. Can be done anywhere.’
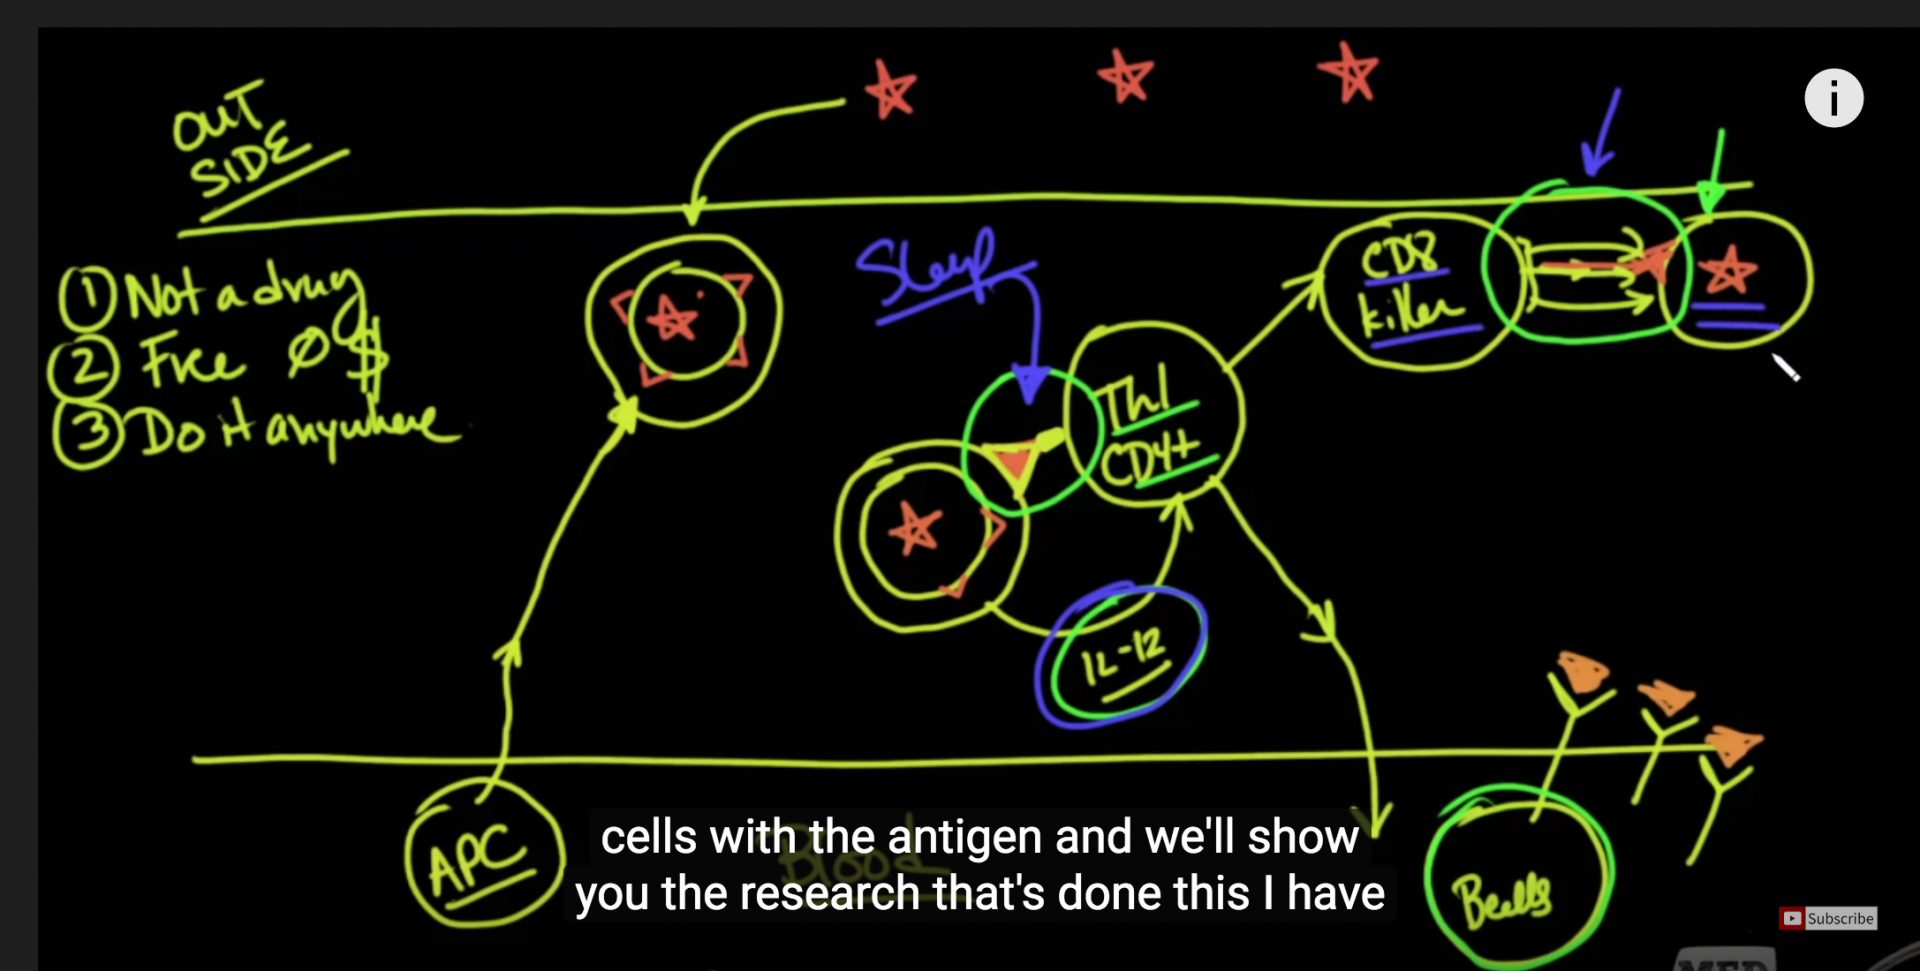
Medcram
I explained that a way that viewers (and listeners and readers) can stay focused and interested in content is to make predictions. We predicted possible answers: exercise, diet, fluids. All predictions were wrong, but we paid attention.
The highlight of the video was an explanation of how the body fights viruses. The students were interested, especially when the video explained that an effective way to boost the immune system is to get good sleep between 10 p.m. – 1 a.m.
We then reviewed the previous day’s brainstormed listing of questions, prior knowledge and projects. I posted these on Google Classroom for them to reflect upon at their leisure.
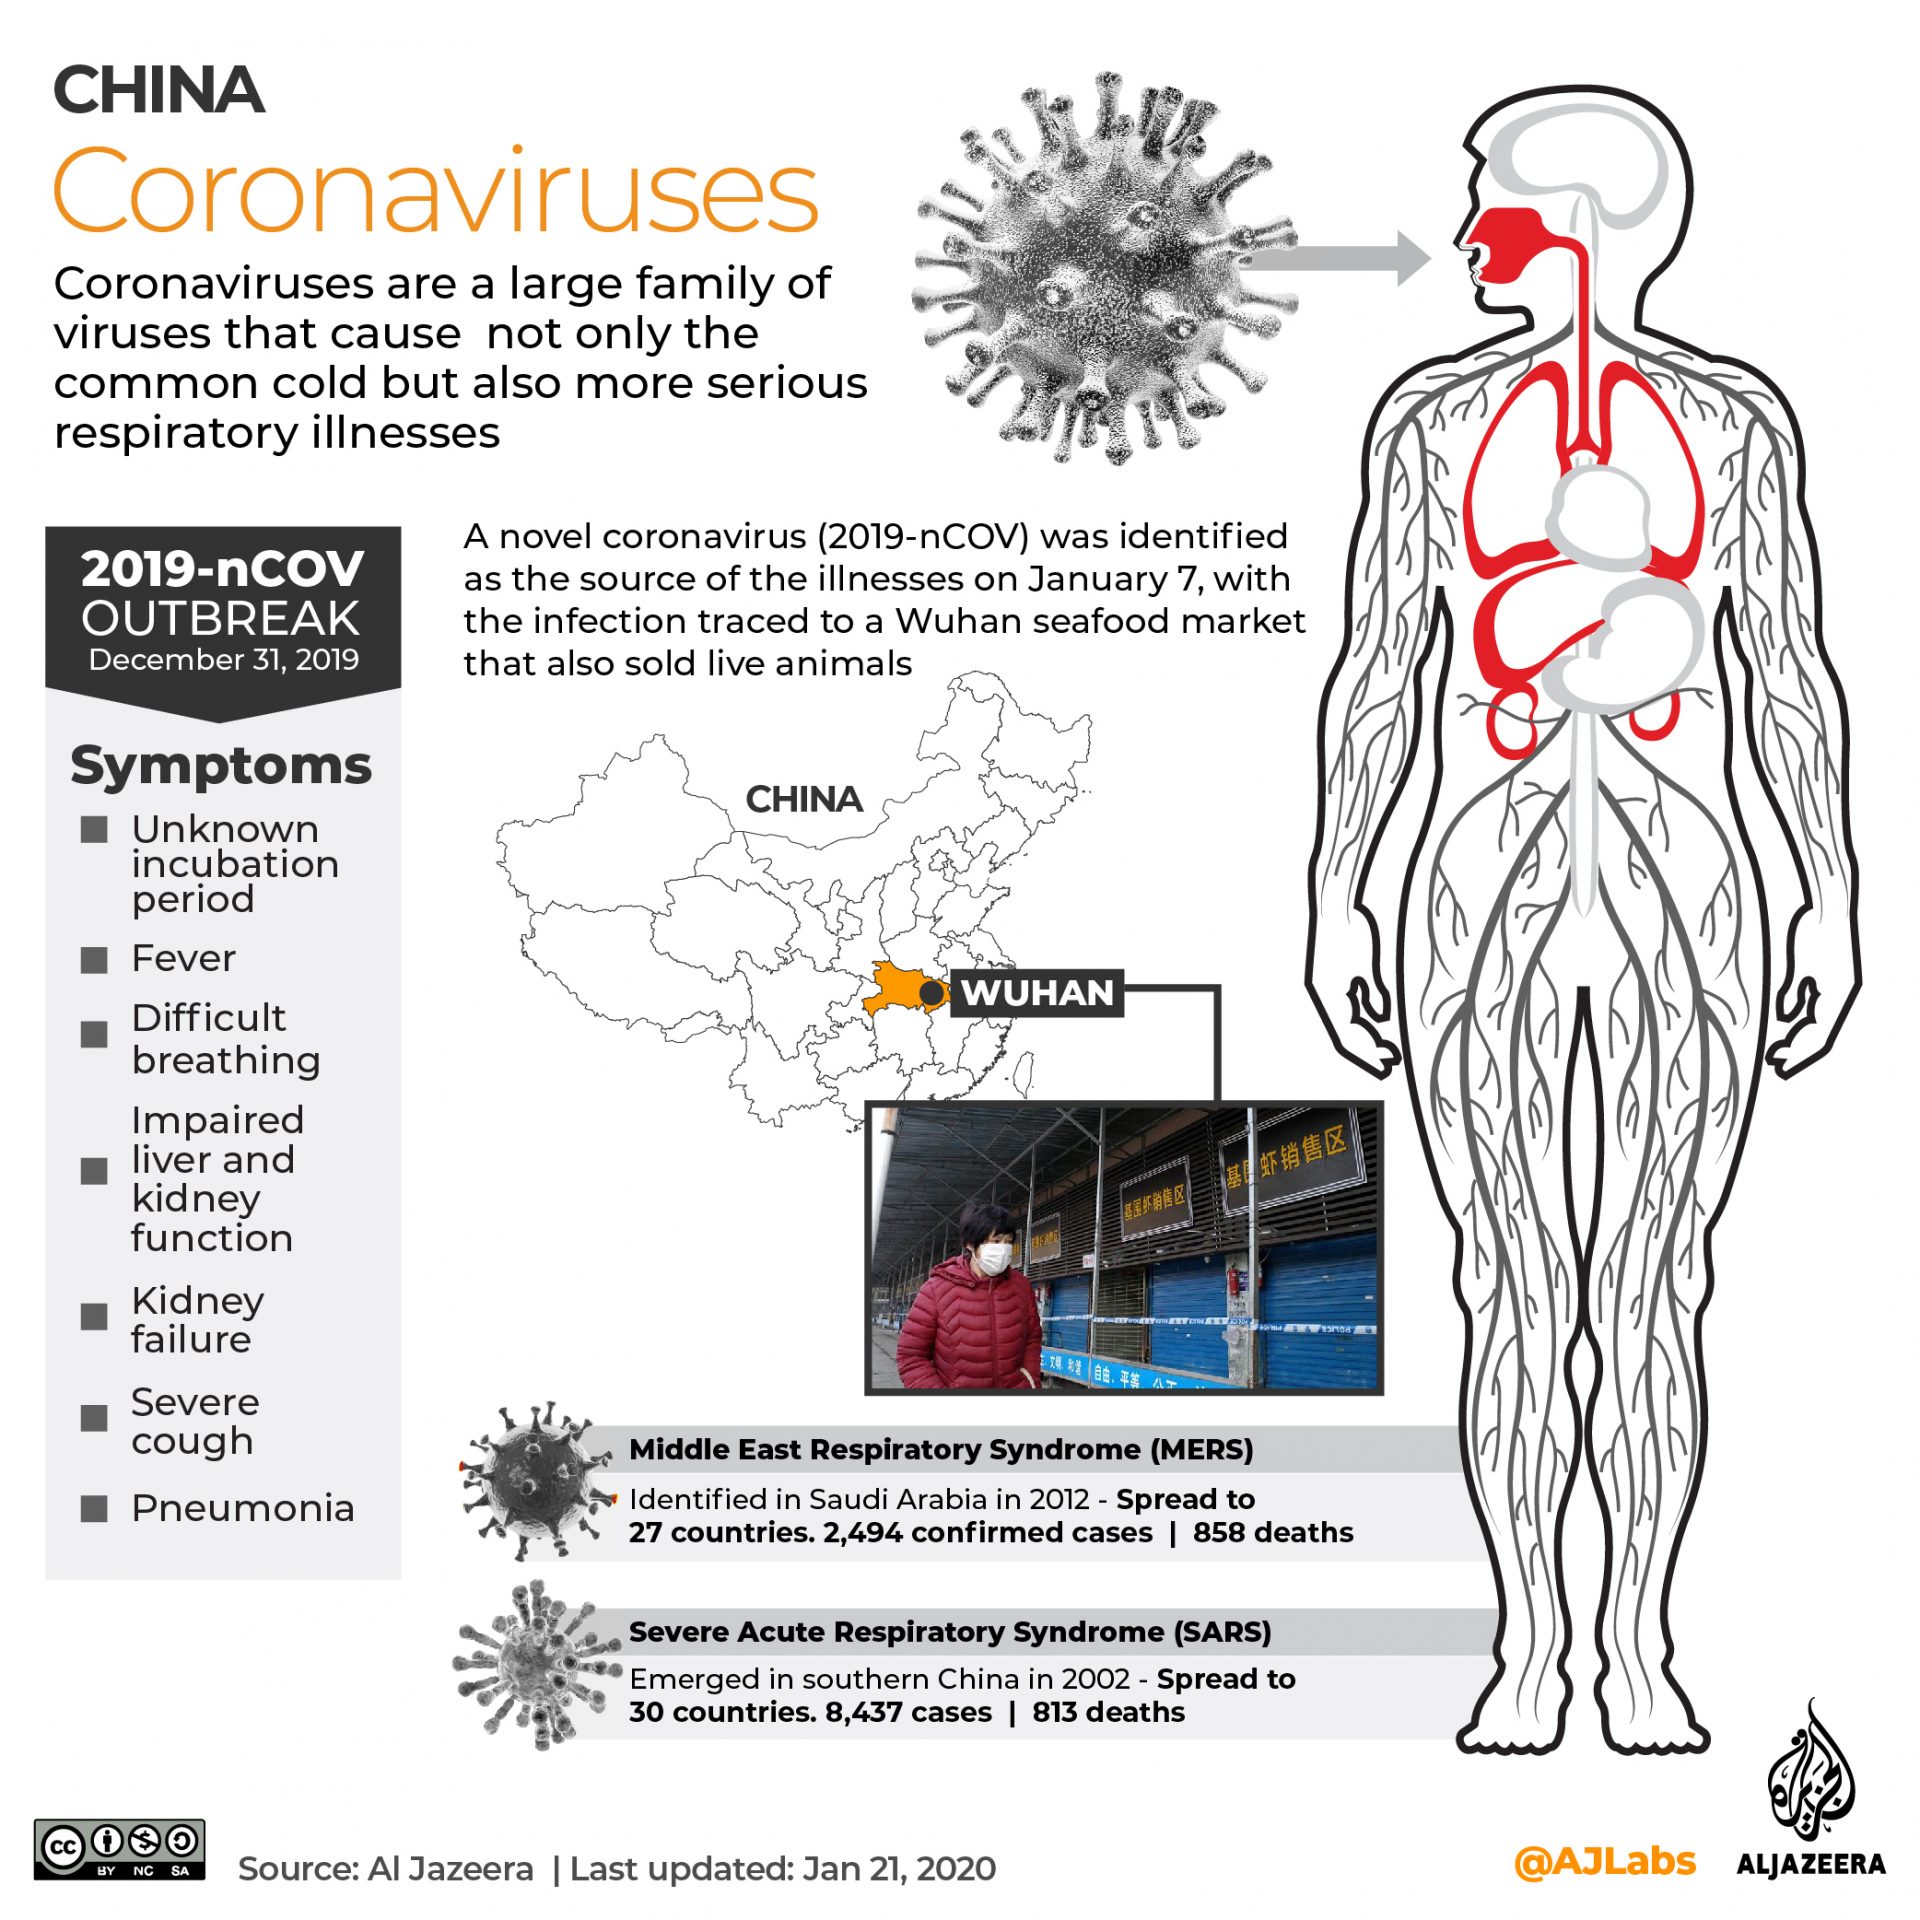
Students were still anxious about what kinds of tasks they might be asked to do and how they might work. I explained that they would form groups according to their interests, then share their research findings. The research findings could become content for a variety of tasks, one of which would be an infographic. I pointed out several infographics posted on the classroom wall. I showed them an Al Jazeerah coronavirus infographic and we assessed its strengths and weaknesses. I described several common-place English tasks: news report, opinion essay, personal response. I explained that we would negotiate which tasks they could complete.
I then gave them time to reflect, talk and research. Several students formed groups and began to choose the topics they intended to research and process. Some approached me and told me their topic selection and group members.
They know that next class will be different because they will be researching and developing products in groups.
Feb. 18
We began the class by extending our knowledge of events that occurred over the 4-day break.
Canadian and American expatriates had flown home from Wuhan to quarantine in their home countries.
There had been more deaths, including the director of the Wuhan hospital.
Students were searching their news feeds as we added information.
We then started a new Google doc of potential student tasks.
I introduced the usual speaking/writing forms that English teachers use for student tasks: description, explanation, persuasion and narration. I told them that I would like to have them do one of each, and that everyone would be asked to design one infographic. I also told them that they would do one oral task—of their choosing—from the list.
We then began to brainstorm potential tasks based on their interests and knowledge. This took a long time, with clarification and classification as to whether the tasks felt like description or explanation, etc.
I explained that they could choose which task they wished to produce as an oral presentation and that we would try to complete one task in the upcoming week, meaning that they had 2 x 2-hour classes.
I showed the students an infographic produced by the Saudi Arabian government during the MERS outbreak. We discussed the strengths and weaknesses of the infographic and imagined ways that we could improve it.
For example, we agreed that the vomiting graphic was easily understood, but that the coughing graphic could be misinterpreted as blowing smoke and the pneumonia graphic could be misunderstood as a stomach ache.
We also noted that the doctor is depicted as male. Students agreed that a male doctor was consistent with Saudi Arabian culture, but that a Canadian infographic could have a female doctor.
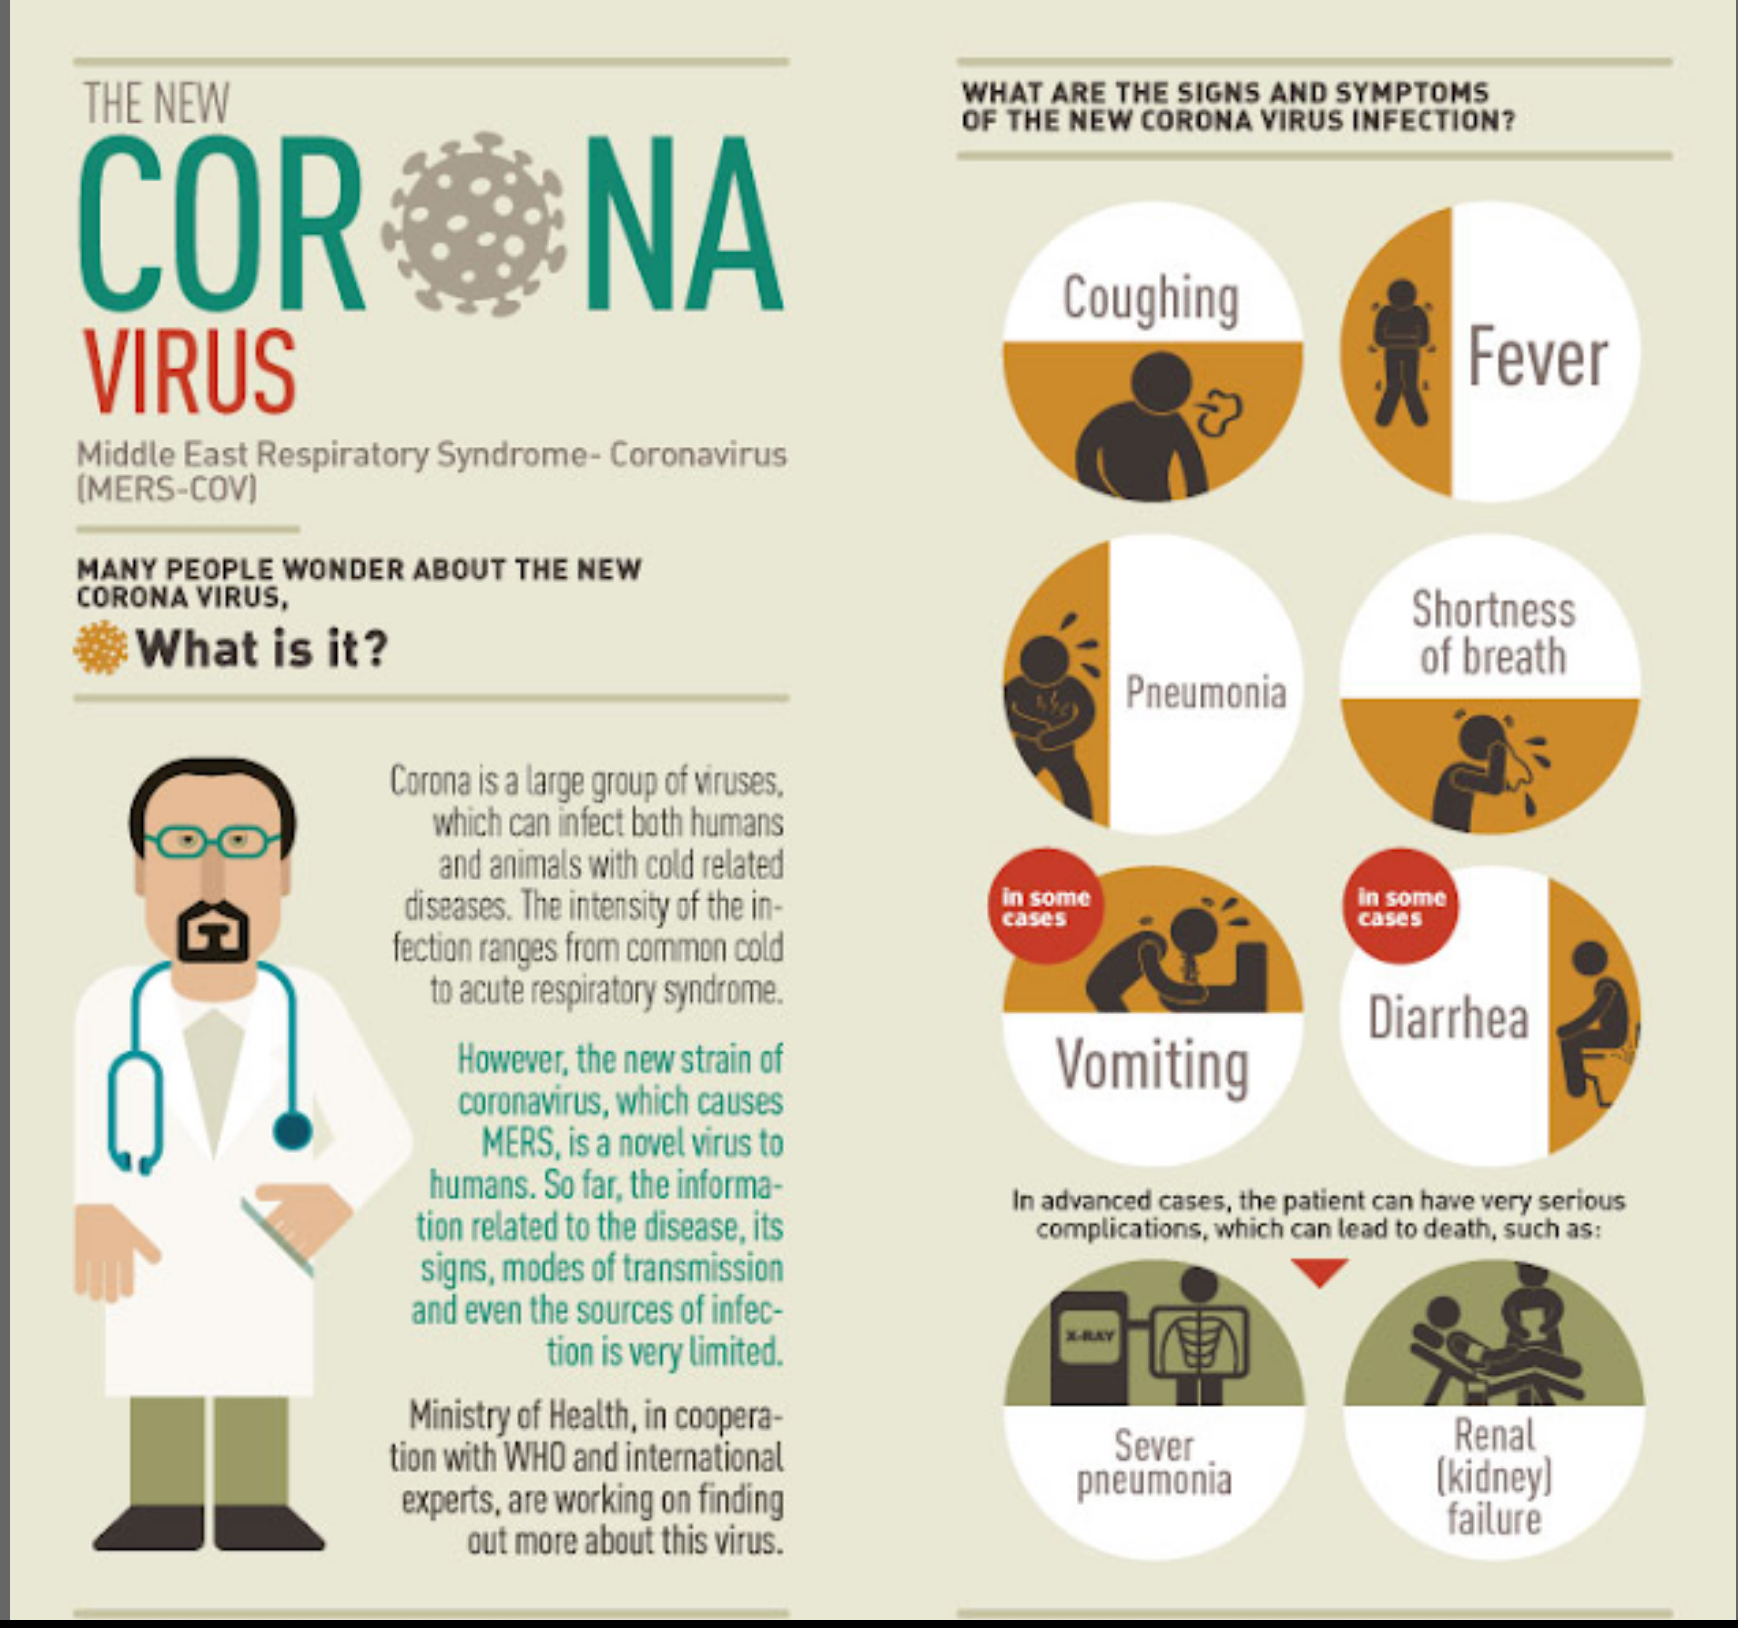
Saudi Arabia Health Ministry
The students then brainstormed tasks. I recommended that we use questions because they would help to guide their research and organization. I also suggested categories for the tasks, in parentheses.
There were many ideas, among them:
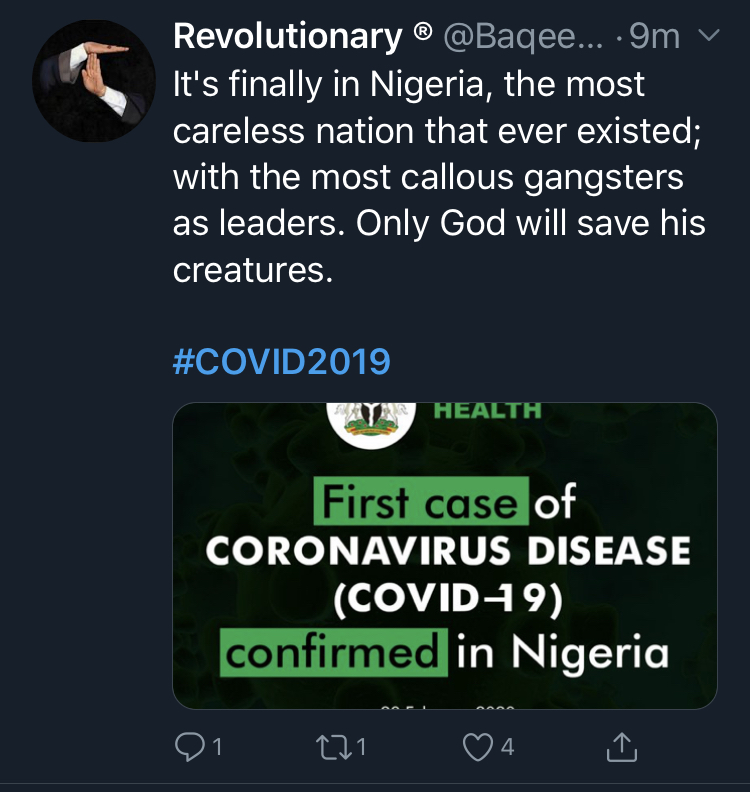
- What are some examples of fake news about covid19?
- What are the effective treatments for covid19? (describe)
- How do the treatments help people recover from covid19? (explain)
- What are the ways that the Chinese authorities took people from their homes? (describe)
- How can we stop the spread of covid19?
- What problems are coming from Hong Kong closing the gates to China? (describe)
- Why is covid19 not under control yet?
- What are different offices’ policies for covid19?
- How can I avoid contracting covid19?
- How can we increase our immune system?
- What are the consequences of closing our borders to protect ourselves from covid19?
- Where will I get a new iPhone—and other Chinese-made products—if the factories are closed?
- How can other countries help the Chinese government fight the virus?
- How can we calm people’s panics over covid19?
- What might be the effect of covid19 on the stock market?
- How might covid19 affect the Chinese economy?
- Can a person be re-infected or do they develop permanent immunity?
- The effects of covid19 on the social life and economic activity of China. (describe)
- What can we eat to avoid covid19 and other diseases? (explain)
- How has covid19 has affected travel to China? (describe)
- How has covid19 affected China’s production lines?
- How has covid19 affected the airline industry?
- How has covid 19 affected travelers?
- Who is selling covid19 medicines? (anti-virals) (describe)
- How long until covid19 is dead on iPhones/pens/cruise ships? (describe)
- How do doctors and nurses treat people with covid19?
- How are healthy people treating people suffering from covid19?
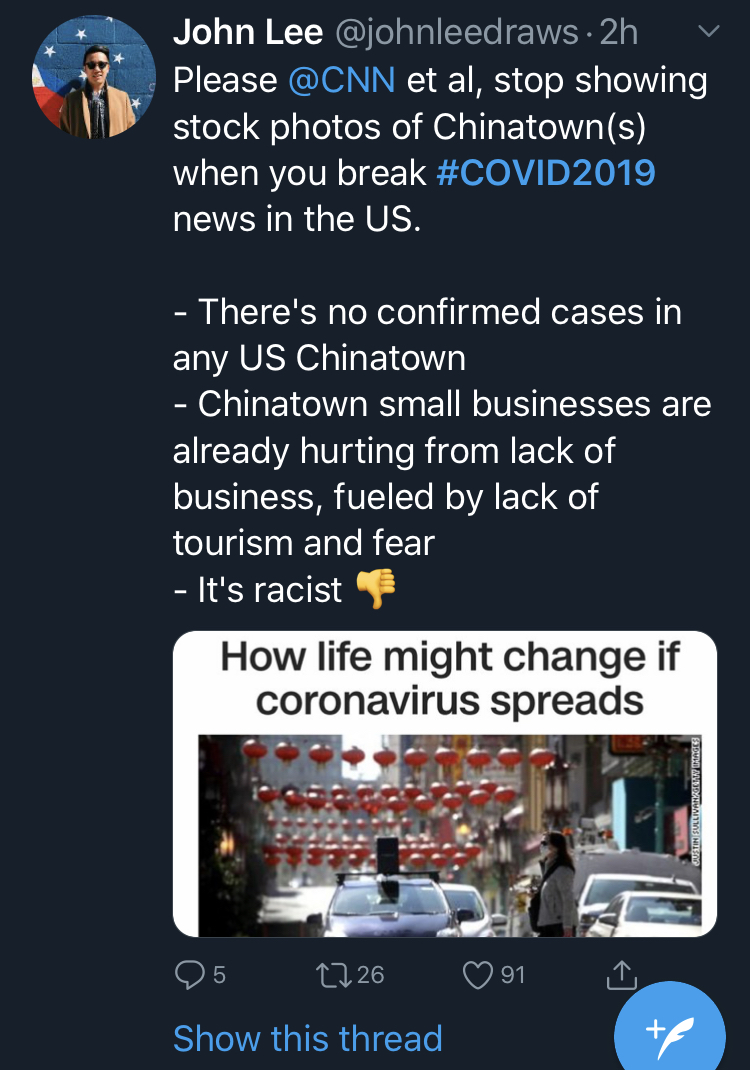
- How has covid19 influenced the way that people think about Chinese people, Asians, and Asian businesses?
- What are countries doing to prevent a covid19 epidemic?
- What is the Canadian government’s response for rapid research and funding?
- What are the symptoms of covid19 and how does it spread? (infographic)
- What will be the future for China if no cure can be found?
- Should the world stop imports and exports with China?
- What will happen to Chinese-produced groceries?
- What is happening to the communities where the quarantines are located?
- How might a boycott of Chinese goods benefit other countries?
- Should Canadians be going to schools and places of worship?
Feb. 19 will be a work day, where students will choose topics and tasks, then research and create.
Feb. 19
I began the class with a recent news broadcast about the Canadians quarantined on the Diamond Princess. I paused the video when two people were interviewed but only the wife spoke, stating how disappointed and scared they were about having to stay on the ship longer due to a postponed flight to Canada.

CBC News
I pointed out that the husband’s site lines were away from the camera for the entire conversation; that he did not engage the reporter but allowed his wife to converse. We talked about what it might mean in Canadian culture when people avoid our eyes. We agreed that the husband too was saying that he was disappointed and scared, but he was doing it with his eyes. This allowed me to point out that eye contact means different things in different cultures, but that in Canada it is considered polite to look at the people we talk to.
The students were still anxious and had difficulty envisioning the tasks arising from their research. I repeated a description of the process I hoped would occur: students would produce 4 tasks; one would be an infographic produced and presented as a group. The remaining 3 tasks would be producing description, explanation and persuasion.
I explained that the description task will describe events, countries, organizations, people, and/or statistics. It might have some explanation, but it will be mostly description and should have mostly facts.
The explanation task will explain how and/or why things have happened, are happening or maybe even predictions of what might happen in the future. The explain task might have some description, but it will be mostly explanation and should present mostly processes or series of events. A frequent organizational device in explanation writing is cause-and-effect.
The persuasion task will be a supported opinion, meaning that it will first state an opinion, then provide examples of and reasons why the opinion is a good one.
Students still needed examples, so I used think-aloud to describe hypothetical examples of each of description, explanation and persuasion. We imagined each one collectively, selecting examples from the brainstormed list, and how each might be presented as a speech. Once we had discussed very concrete examples of each form, they relaxed and began planning and researching.
One student approached me with a list of 4 specific tasks representing her plan to produce a graphic organizer plus description, explanation and persuasion chosen from the brainstormed list. I asked if she would share her plans with the class and we described her plan to everyone else. Again, this was a concrete model describing the 4 tasks and it helped the class envision their own choices.
They talked in their groups, testing ideas and imagining tasks. Several approached me with ideas to try out and we discussed why they would work well or if they needed more scope or content. Some students researched on their phones while others went to the library.
Feb. 20
I presented a summary hand-out describing all the tasks, some key criteria for assessment, and the overall schema that 1 task of the students’ choosing would be delivered as a speech. I also showed them the rubrics I had designed for the infograph and the speech.
Some were still struggling with the combination of tasks and with the freedom of choosing which task could be delivered orally, but they all understood when we reviewed the task summary.
I said that one task should be due next class, and suggested that it should be one of the two writing tasks as having one writing task due first would distribute the writing tasks across the unit. They agreed.
These students have children and jobs, so working in class is often their only school time. Therefore, I made the first task due at the end of the next class.
I also asked them to include bibliographies at the ends of each writing task and showed them how to harvest the URLs from each online article by emailing the URLs to themselves. (Most research on their phones.)
I addressed plagiarism, whose penalty is a zero evaluation in this school, and explained that all their writing needed to be their own. We discussed how they were conducting considerable research on millions of words and hundreds of videos freshly created within the last two weeks. The temptation to re-use some of that writing would be great.
I demonstrated how I could use Google search to find the sources of any suspect sentences. I counseled them to put any quoted writing into quotation marks with citations to avoid committing plagiarism.
As they worked, I consulted with individual students to clarify their choices and review their draft assignments. Many had completed draft tasks, most of which were very good, especially in terms of their organization.
One student wrote me a note in which he objected to producing tasks on the Covid-19 pandemic, stating that he found the event too depressing to think about. I suggested that he produce the same 4 tasks, but to use another current event—the conflicts between the Ontario teachers and Ontario government—as the content. He said that he could easily imagine how to transfer the tasks to the new content, thanked me, and got straight to work.
Feb. 24
As I reflected on my teaching over the weekend, I realized that I had not supported the students’ understanding of the persuade task. If I expected them to produce a proficient supported-opinion assignment, I needed to provide both assessment criteria and exemplars.
A search found a writing-a-persuasive-essay ‘‘tip sheet‘ and a set of student-written supported opinions responding to the question, Are cellphones necessary in teenagers’ lives?
We discussed the tip sheet criteria. We explored and assessed 2 of the essays. Because most of the students are second-language, I read the tip sheet and essays out loud. That ensures that everyone reads the sheets, but also that they hear Canadian English.
We discussed essays #2 and #3 paragraph-by-paragraph, using the tip sheet to assess their effective uses of language and organization. Before I read #1, I said that I would ask them to rate the 3 essays Gold, Silver and Bronze when I finished reading. I chose Gold, Silver and Bronze because it made the exercise feel more important, like an Olympic event. They then had 10 minutes to discuss and choose their Gold, Silver and Bronze winners.
We discovered that no table group selected #2 as Gold, but that different groups had selected either #1 or #3 as Gold. This was great because we could discuss why we agreed that #2 was not worthy of gold. We could also compare and contrast the merits of essay #1 and #3 and see why different groups had chosen them as Gold medal winners. It didn’t matter if they were right or wrong; what mattered is that they had applied criteria and had reasons for their choices.
The discussions resulted in the students’ understanding how to structure a supported-opinion essay as well as be able to spot and fix errors in sentences and paragraph structure.
Feb. 25
Students are working on the full range of assignments, although most seem to be working mostly on the 2 writing assignments.
I conferenced with them one-at-a-time to correct their English language usage and suggest ways to achieve persuade, describe or explain. We had already agreed that describe tasks will contain some explain, that explain tasks will contain some description, and that persuade tasks will use both description and explanation to support the opinions. It is a matter of proportion. I was impressed with the quality of their sentence construction and organization.
I also proposed a seemingly crazy idea—and admitted that it was a little crazy—that students were welcome to produce their infographics in their first languages if they so chose. I explained that they could add Post-Its in English to demonstrate that they had used appropriate English language conventions.
They found the idea intriguing. We will see if anyone takes me up on the offer. (One group blended English with their first language on their infographic. All others wrote English.)
Feb. 26
Nations made a major shift today. Up until now, they had been talking about containing Covid-19. Today they admitted that containment efforts have failed. The virus is uncontrollably active in Iran, South Korea and Italy. One student observed that the failure had been a human one, meaning that people had violated rules and guidelines that might have contained the virus, but human actions had spread it.

WHO
The US and Canada are shifting from containing to managing Covid-19, assuming that the virus will infect a significant proportion of their populations. They are assessing their health treatment infrastructures and bolstering them as well as they can.
We considered how the Covid-19 landscape had changed continuously during our study and how students had to continuously update their work. It makes the unit exciting, and is causing students to date their work for accurate context. This has been a major distinction from a standard object of English study, like a novel or a play.
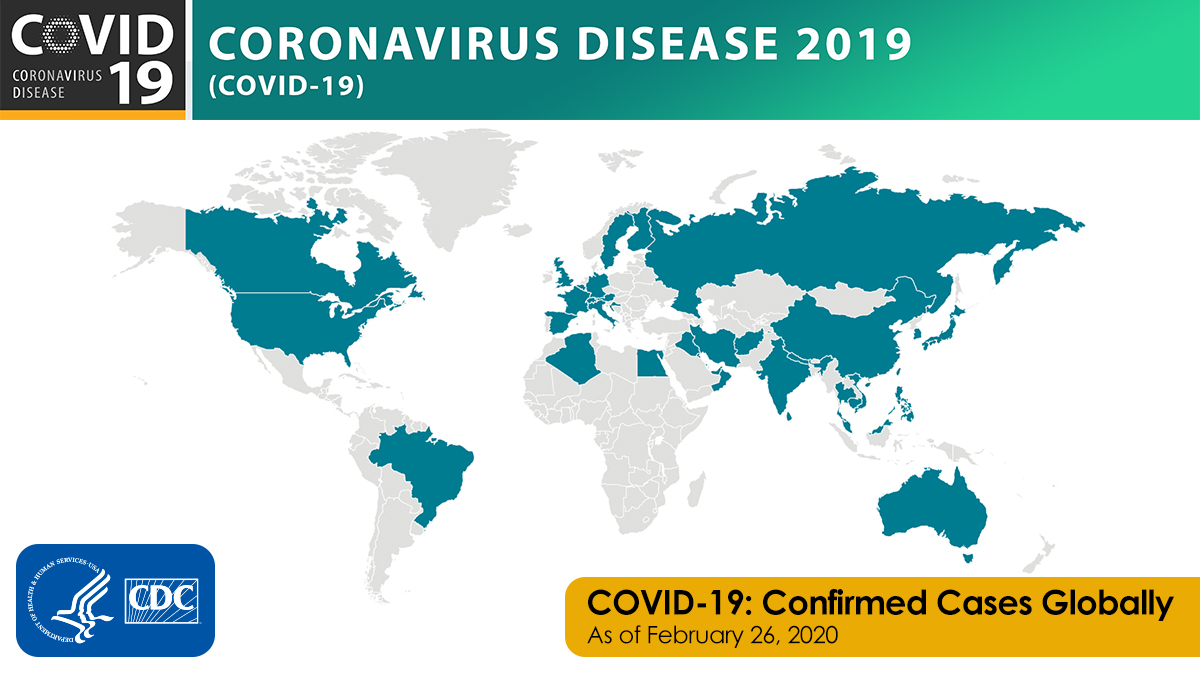
CDC
Several students handed in assignments, all of them written submissions. They were well-written, with good organization of ideas and a variety of sentence structures. Students had used a wide variety of subjects and sources.
Feb. 27
One student’s oral presentation provided completely new information that none of us had seen. He presented a website and did an excellent presentation that illustrated that there are now different mutations of Covid-19 in different countries. That was a sobering moment for all of us, because he helped us realize that a vaccine for one strain might be ineffective on another strain. That means that either people will have to be vaccinated against multiple versions of the virus, or that they might be infected repeatedly by different strains. This became a very compelling intersection of science, medicine, travel and economics.
Feb. 28
March 2

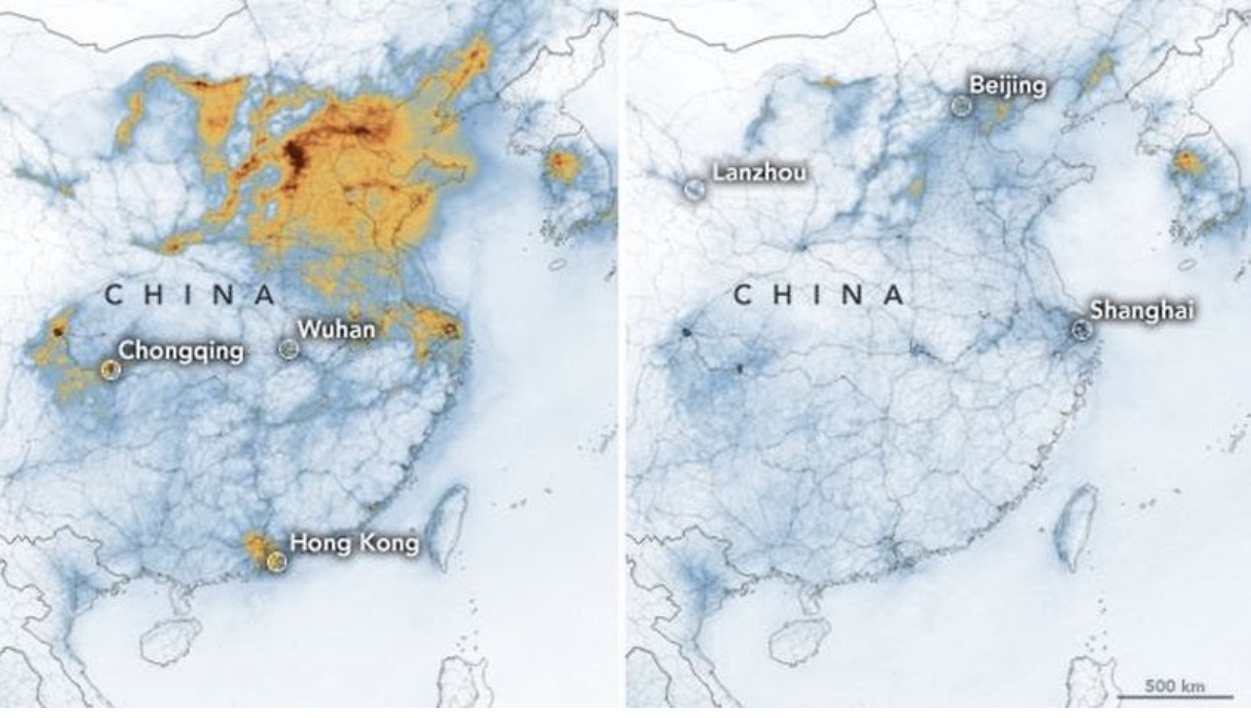
NASA
March 3
March 4
Singapore

Singapore Health Ministry
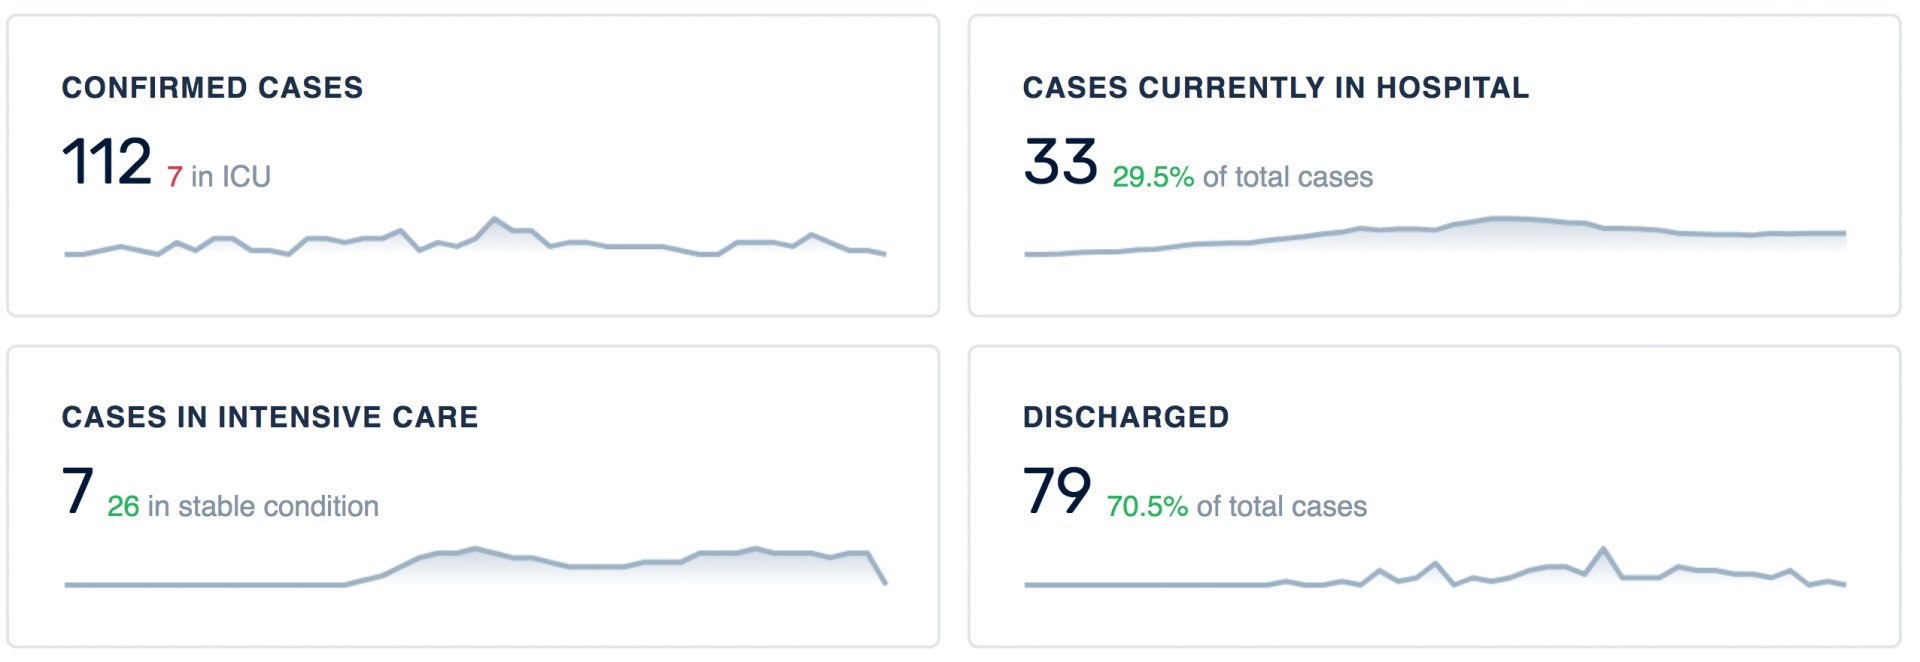
- Why is there no blue (confirmed cases) until day 3 of the graph?
- Why is teal (discharged cases) not represented until February 4?
- Why does the gold (symptomatic cases) decline toward the end of the graph?
- What might it mean that the teal (discharged cases) is more common at the end of the graph?
What do you think?
1. Why is there no blue (confirmed cases) until day 3 of the graph?
We hypothesized that January 21 was so early in the Covid-19 saga that Singapore’s medical staff didn’t know the first patients had Covid-19. It was before testing, etc. so how could they confirm the cases?
2. Why is teal (discharged cases) not represented until February 4?
We remembered that the quarantine period was 14 days, so there shouldn’t have been any discharge until the quarantine period had transpired. When we counted the days, we found the first discharge date matched the quarantine period.
3. Why does the gold (symptomatic cases) decline toward the end of the graph?
We hypothesized that the medical staff was getting more expert at diagnosing the virus and they would want to identify and move patients into quarantine, so cases were moving so quickly from presumptive to confirmed that no presumptive cases were registered.
4. What might it mean that the teal (discharged cases) is more frequent and larger at the end of the graph?
We hypothesized that patients were getting better. This is good news for Singapore and Canada because we want to be assured that many people recover.
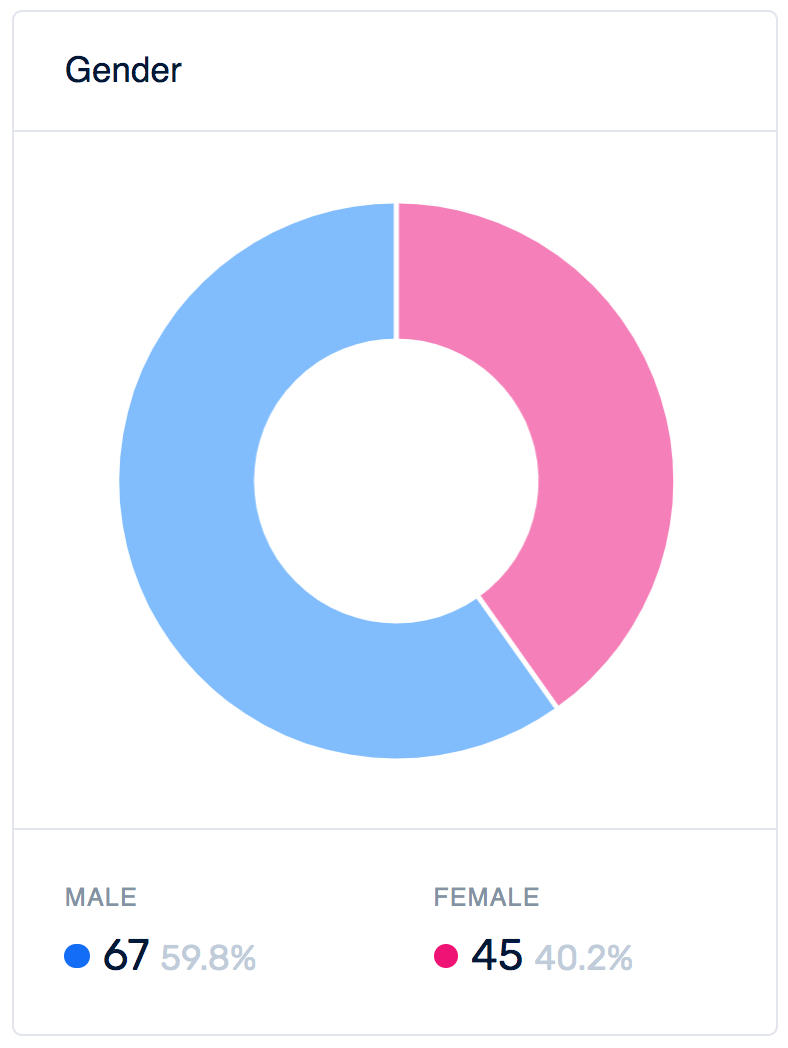
The next graph we looked at represents the ages and sexes of patients.
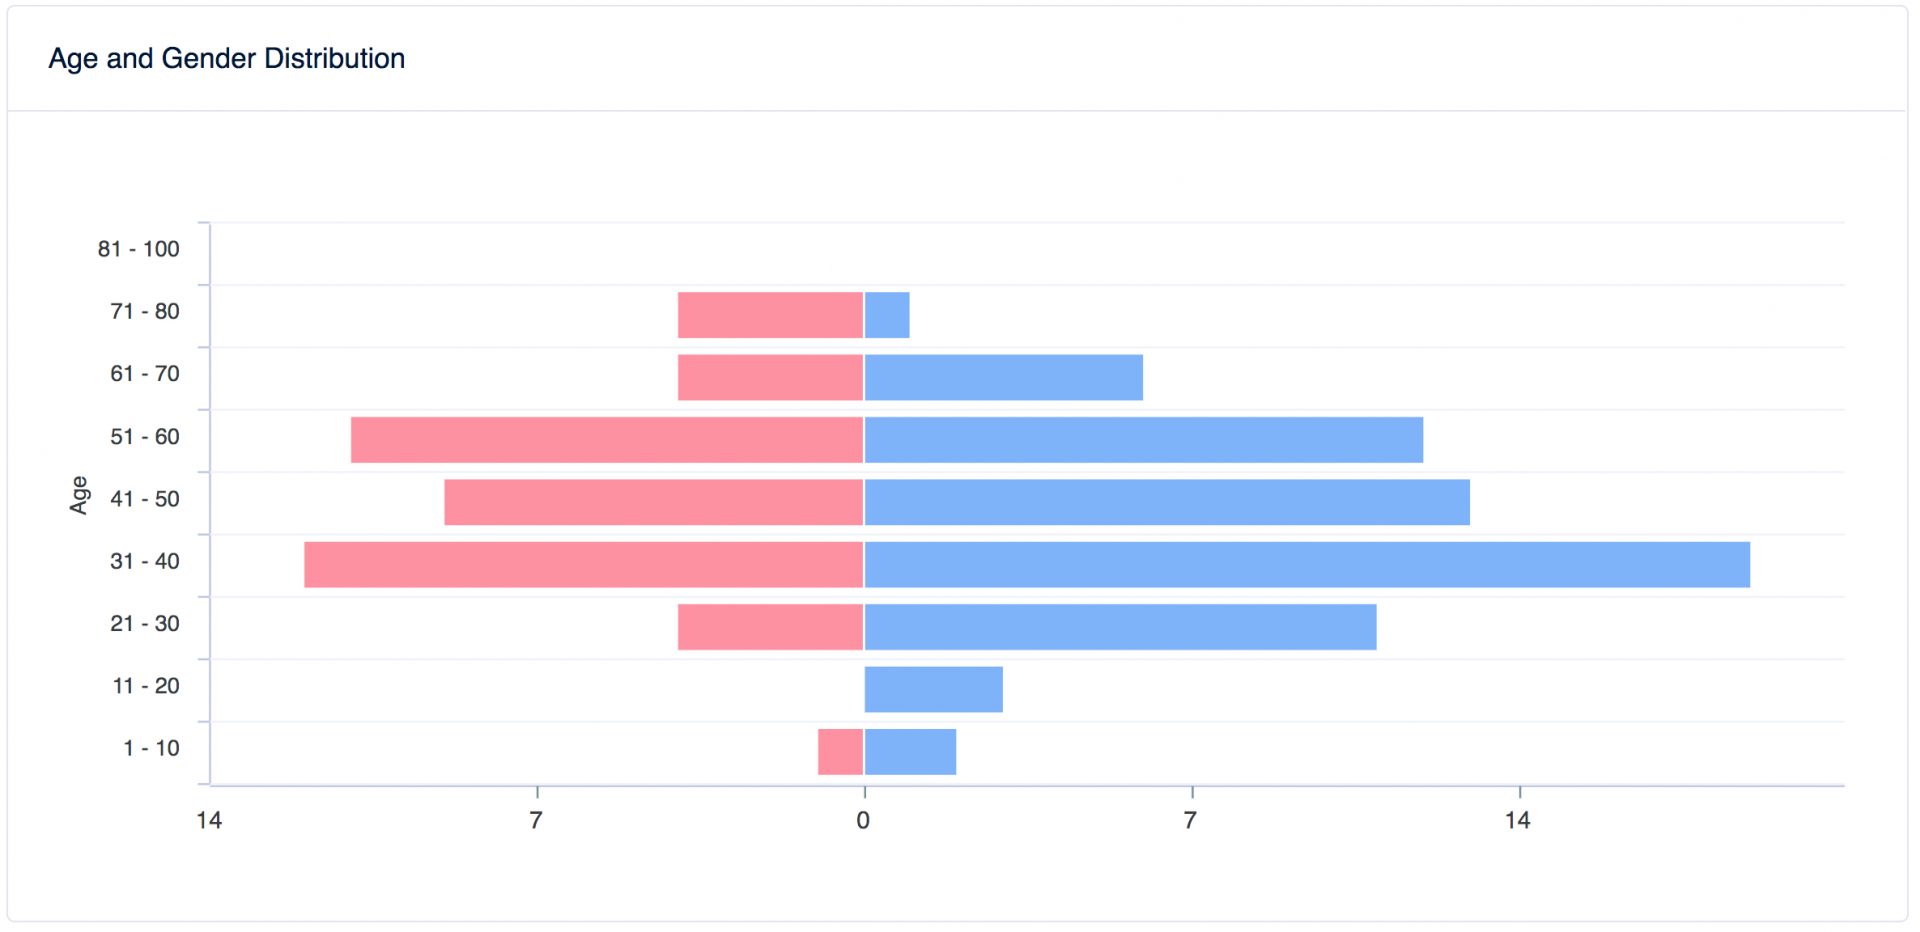
Singapore Health Ministry

Singapore Health Ministry
March 6
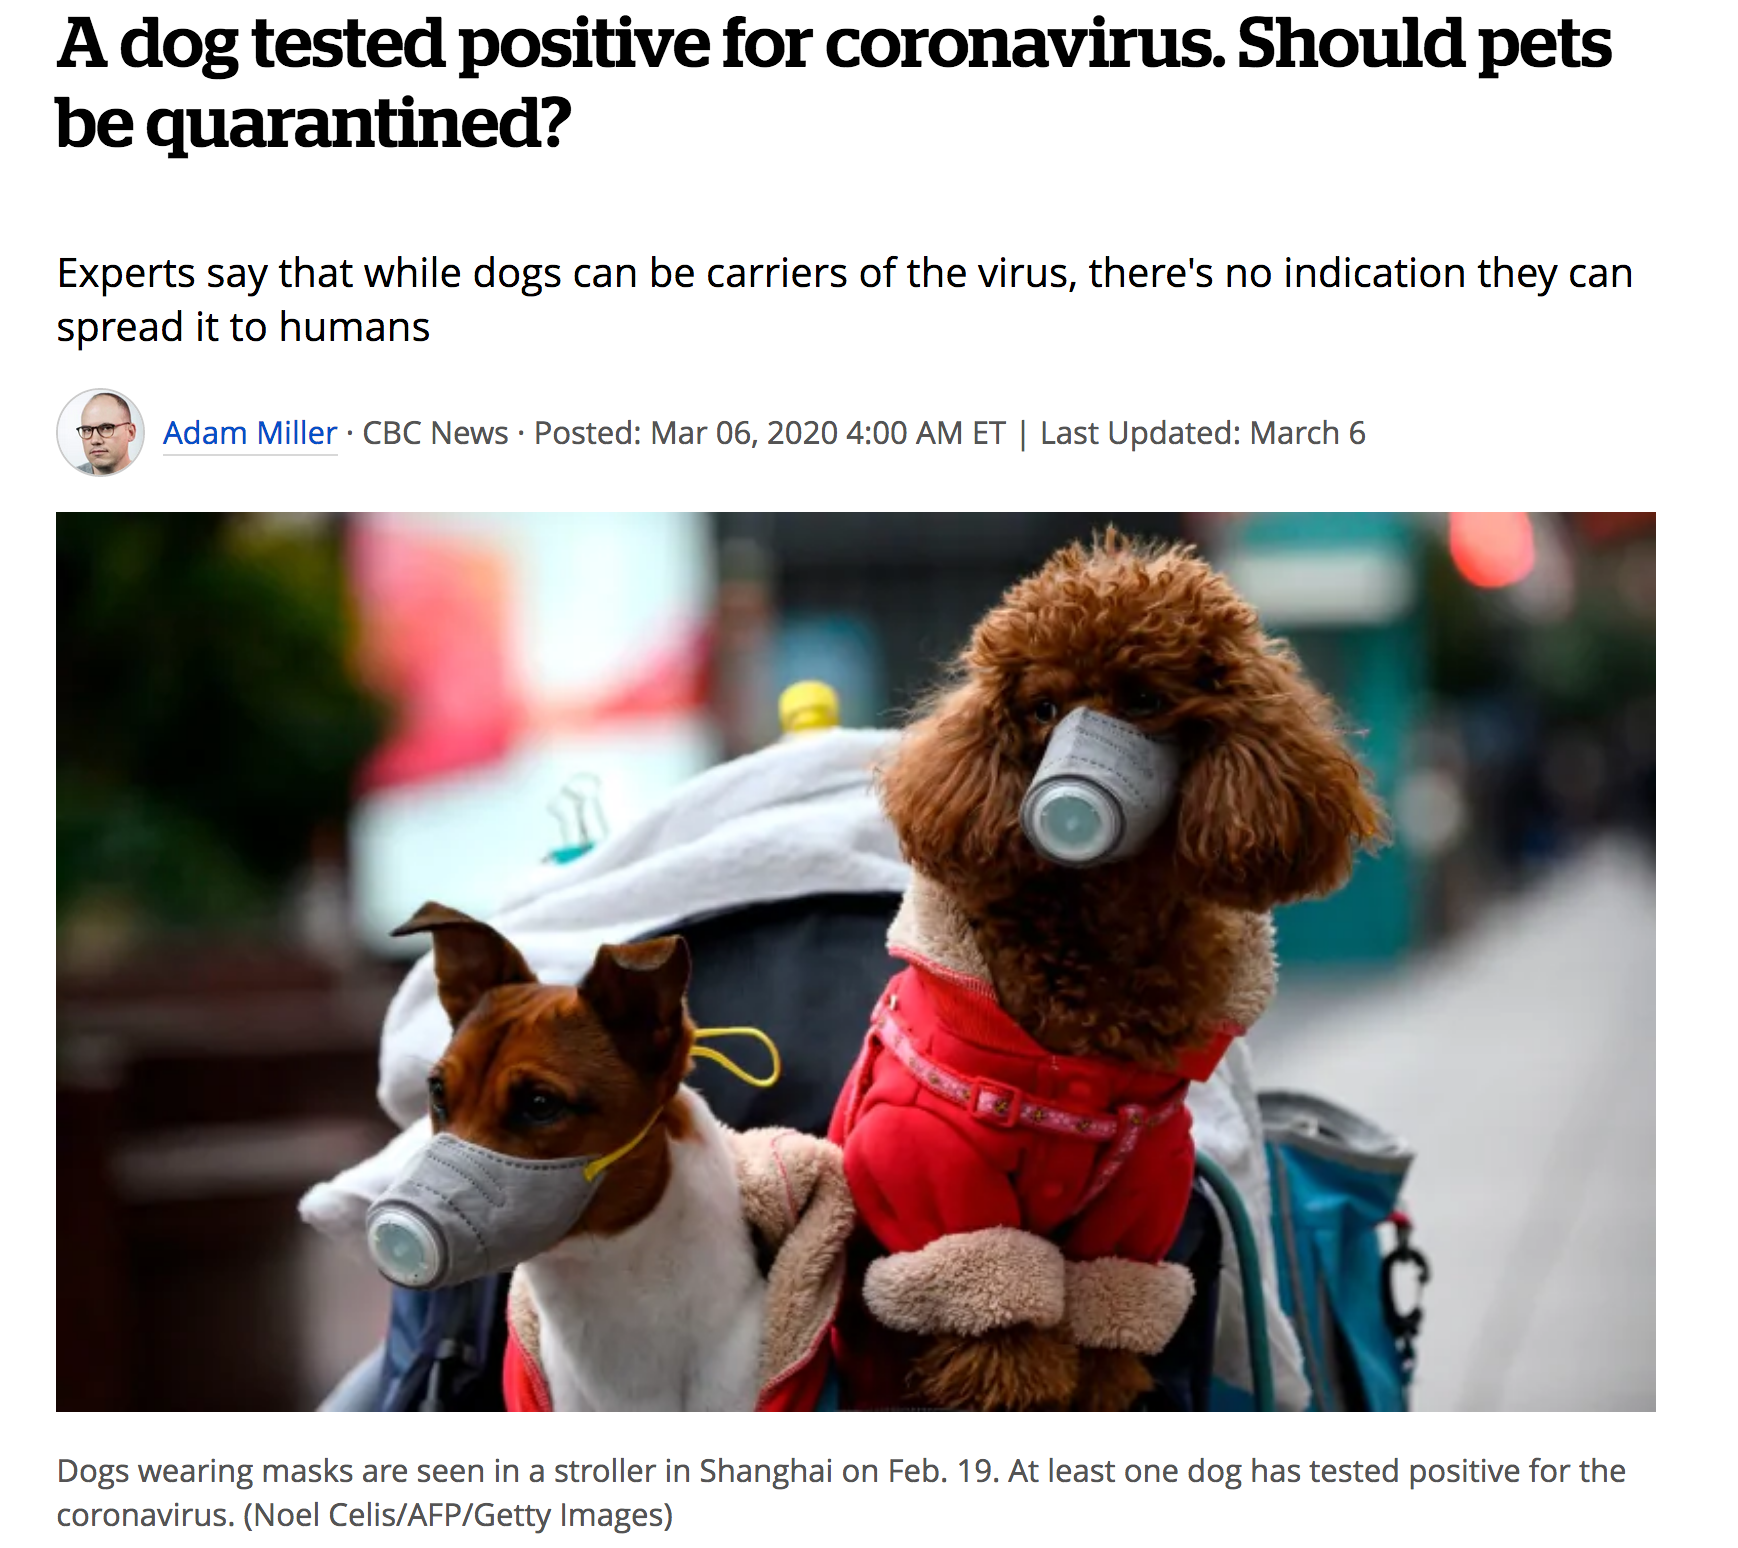
CBC
March 9
We saw some great infographics today (will post some when I acquire student permissions) and heard some good speeches.
One student gave a very provocative speech supporting his opinion that Covid-19 is a recent example of the long history of biological warfare. He began with a brief history, showing images of nerve gas from WW1. He then explained that Covid-19 is not a natural virus, but man-made in a lab. He presented the thesis that it was created in the USA, that Chinese agents were provided with antibodies and were hired to spread the virus on surfaces in Wuhan. He showed a video he had received on his social media account that presented random people in security videos spitting on store merchandise, elevator buttons and outdoor restaurant tables. He stated his opinion: the US is angry at China but cannot engage China in military warfare, so it has chosen to weaken China’s economy via germ warfare. He claimed that the US has known about Covid-19 since summer 2019.
The class responded with many great questions.
What were the sources to support his claim that the virus was produced in a US lab?
How did he know that the virus is man-made?
When and where were the videos recorded?
He could only respond that he had researched on the internet. The class was not satisfied. This gave me a great opportunity to talk about testing for fake news by triangulation (vocab opportunity). We agreed that, while his presentation was plausible, it could not be proven.
Another student—who has been tracking Covid-19 fake news for the whole unit—had seen the video and said that he believed it. That caused further consternation. We all agreed that we had seen security videos of Asian people spitting on store merchandise, etc. but that there was no evidence of what they were spitting, where they were, or the date.
None of the students had heard of snopes.com, so I went to the site and asked, ‘is Covid-19 American bio warfare?’ Snopes had no answer. We were not surprised because the Covid-19 info is so new.
March 10
A student made a fascinating presentation on Covid-19 fake news. First, he showed us several examples, then he explained how they were fake news. He finished by explaining how damaging fake news is to people because it fuels the second virus: fear and panic. People make bad decisions when fearful, like buying fake cures, hoarding toilet paper and food or traveling away from places they think are dangerous.
The class paid close attention and was very glad to know and understand the many forms of Covid-19 fake news.
March 11

canada.ca
White-skinned superheroes washing.
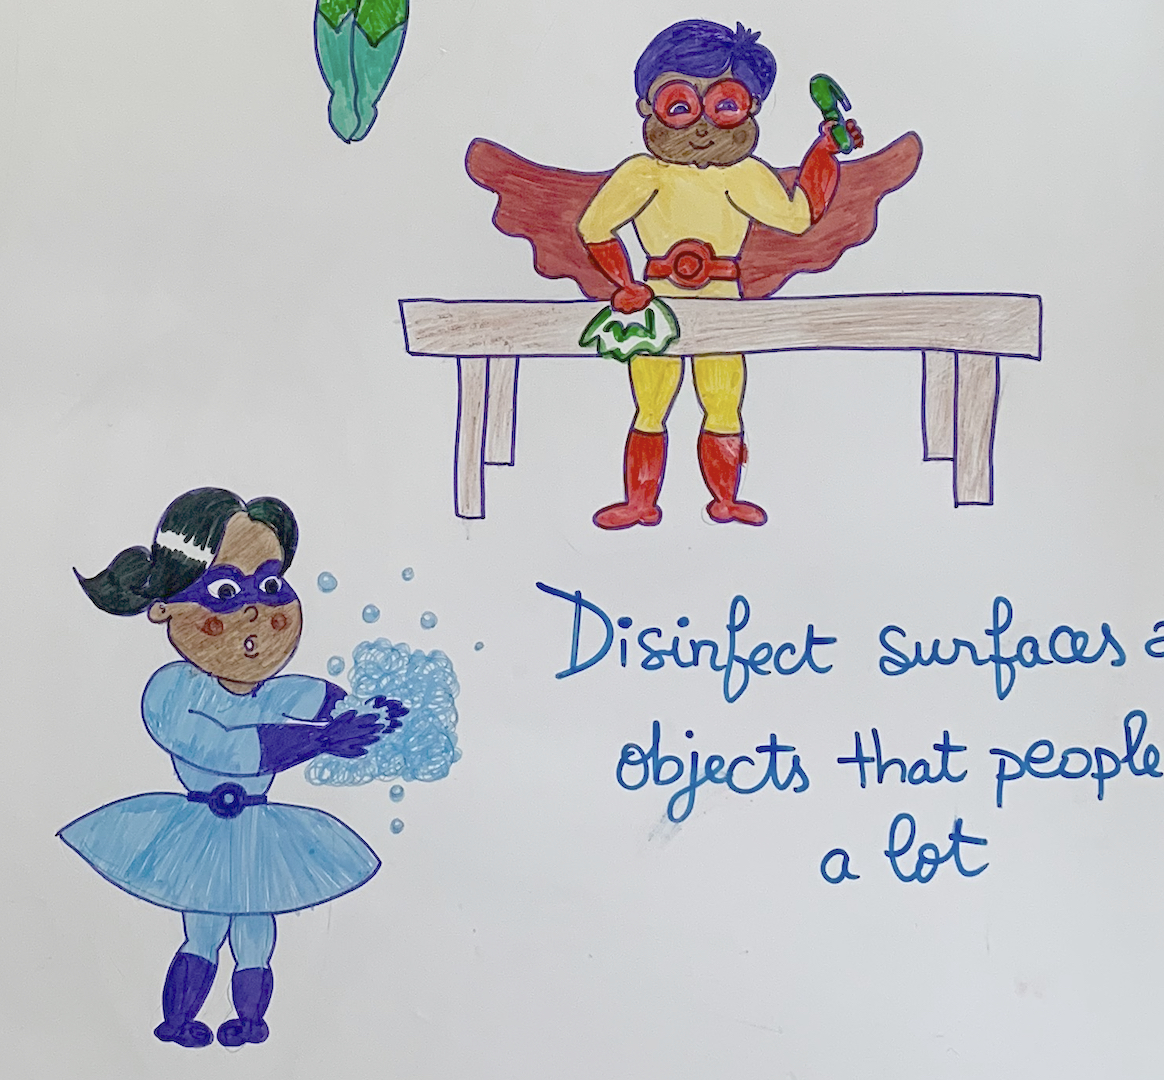
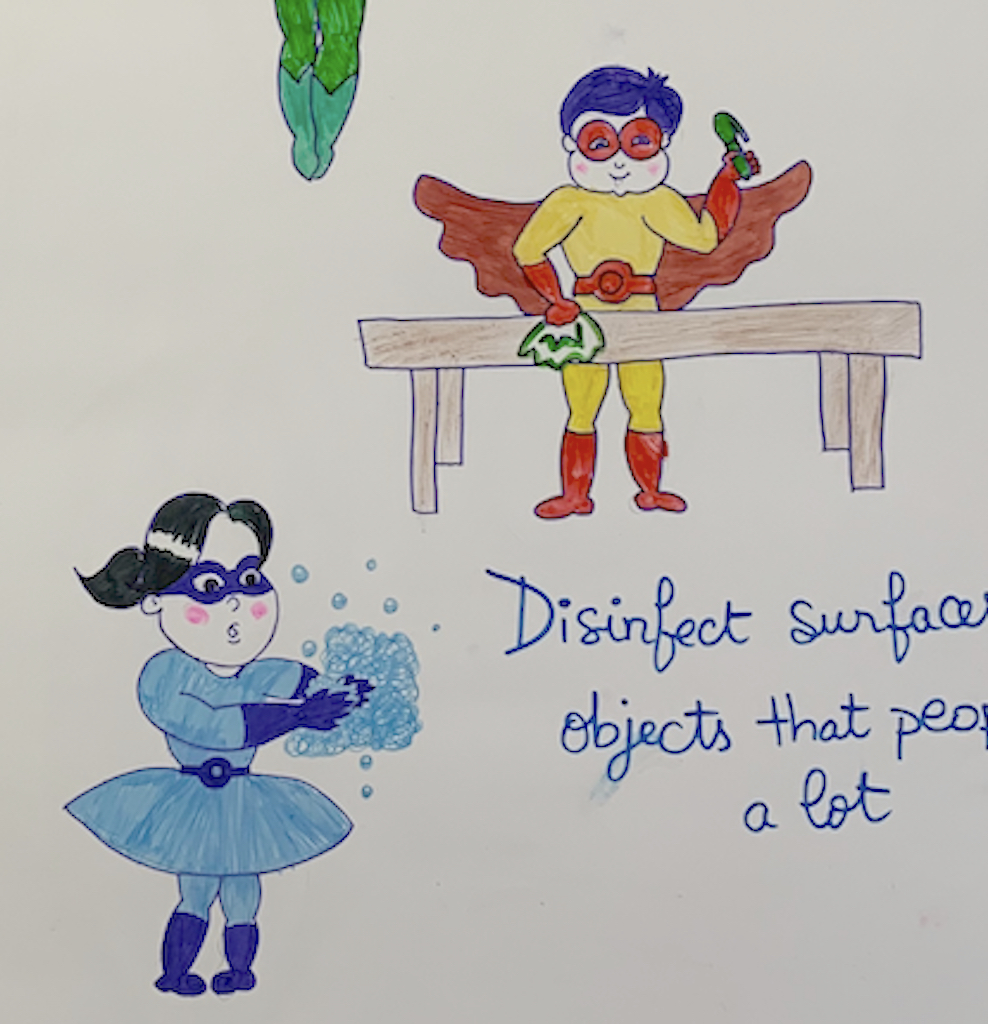
Brown-skinned superheroes washing.
Here is the full revised infographic.
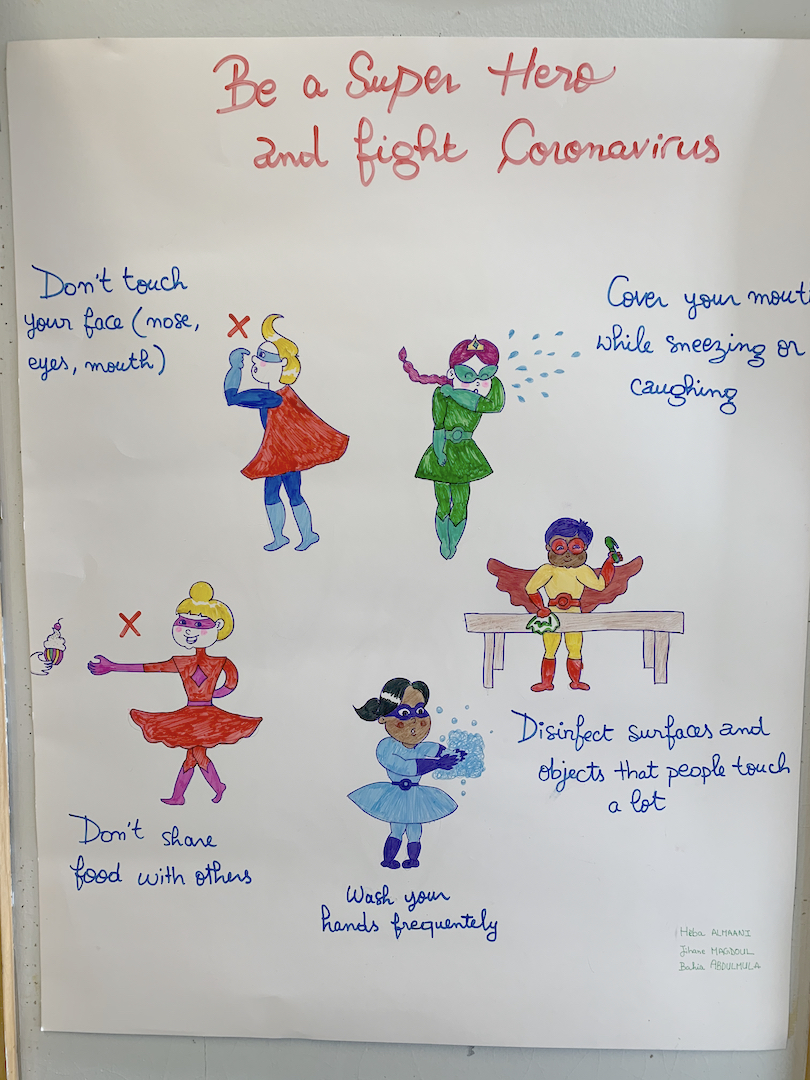
Heba Almaani, Jihane Magdoul, Bahia Abdulmula
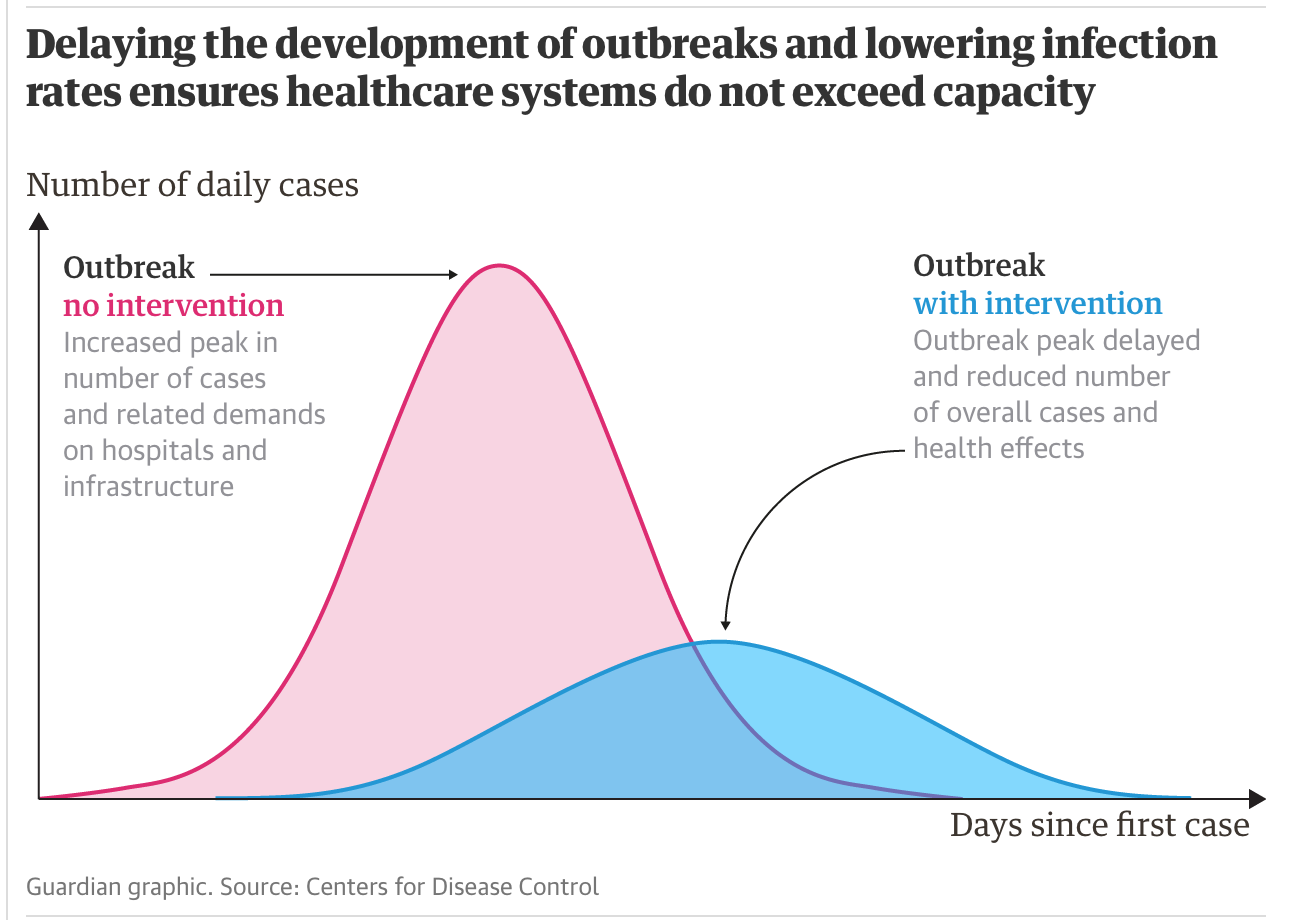
I shared an infection graph that represented two possible models of the spread of Covid-19 in Canada. The red curve represented an uncontrolled spread, as occurred in China and Iran. The blue curve represented a controlled spread, as has happened in Japan and is currently occurring during the total lockdown in Italy.
CDC
We talked about how the graphs were helping us visualize the benefits of self-quarantine, hygiene, sleep and diet in slowing the spread of the disease: the same number of people might be ill, but flattening the curve will allow the medical system to avoid being overwhelmed by new cases. This will save lives.
Today we also planned the unit test. I wanted the students to be a part of the planning and designing of the test. I explained that I needed them to demonstrate a knowledge of writing—organization, forms, paragraphs, sentences—but that the form and content could be flexible.
I wanted them to feel like the experts they had become, so I suggested that we frame their writing as an email message to someone of their choosing—friend, relative, acquaintance, etc. who knew little about Covid-19. We settled on the prompt:
“Write an email to a real or imagined recipient who will be traveling out of Canada—or into Canada—by air during March Break. In your email, describe, explain, inform, warn and give advice to the recipient about what they should expect to see, hear, feel and do when they travel.
Describe the risks they are taking and how they might manage those risks.
It is OK to use “I statements,” e.g., ‘I think you should be careful when on the aircraft…’”
The students read and approved the test, so we agreed to hold it in two days. They could use the next class to rehearse their answers in groups.
March 12
This was the second day of the principal cautioning students to wash their hands frequently and telling them not to panic, because Canada has very few Covid-19 cases. The students gave one another knowing glances.
The WHO has declared the epidemic a pandemic. France and Sri Lanka have closed their schools. Justin Trudeau is in self-quarantine. 27 people died from drinking industrial alcohol (97% as compared to 5% beer) in Iran because fake news had reported that alcohol kills the virus. Governments are releasing funds to support medical preparations. We saw the school’s first mask-wearing student. We imagined that Canada would be very different when we returned from March Break.
Students wrote their Covid-19 tests.
March 13
Interesting day for a Friday the 13th. When we began this journey on Feb. 12, I had asked the class how many thought they would get Covid-13. Not only did none of them think they would get it, none of them thought that anyone in the school would get it.
We had seen the steady expansion of Covid-19 from Wuhan to the rest of China and its rapid transit to Vancouver and 3 cruise ships. We had seen the explanations of how the virus acted upon bodies and what people could do to avoid and fight the disease in the absence of a proven anti-viral. We had researched the economic impact of Covid-19 on China and, consequently, the countries that depended on Chinese tourists and products. We had talked about ‘pandemic’ weeks before the WHO had made it official. We had seen countries be completely open (Singapore) and guarded (Iran) about what they reported. We had seen some strategies succeed and some fail. We had seen ‘containment’ change to ‘mitigation’ as the WHO director spoke continually about the ‘window of opportunity’ until he admitted that it had closed.
Late in the afternoon of March 12, the Ontario government announced that it was closing all public schools the next day, i.e., without even 24 hours notice. We had seen Japan, Italy, Iran, and Poland close their schools, but we hadn’t thought it would happen to us, at least not so soon. Now we were saying good-bye for 3 weeks. It was shocking to see a month’s-long object of study—WHO press conferences from Brussels, newscasts from China, cruise ships in Japan and California, empty streets in Milan—become our reality.
The school was on a shortened-day schedule. The students were already befuddled by the announcement of the closure—some knew when they arrived but others didn’t learn of it until the principal’s announcement. The revised schedule further fazed them.
Surrounded by their infographics describing Covid-19’s health and economic impacts, we bid farewell and wished one another health and good luck until we met again. Because of our research, viewing, listening, writing, speaking, infographics and conversations, there were no illusions about what to expect in the next 3 weeks.
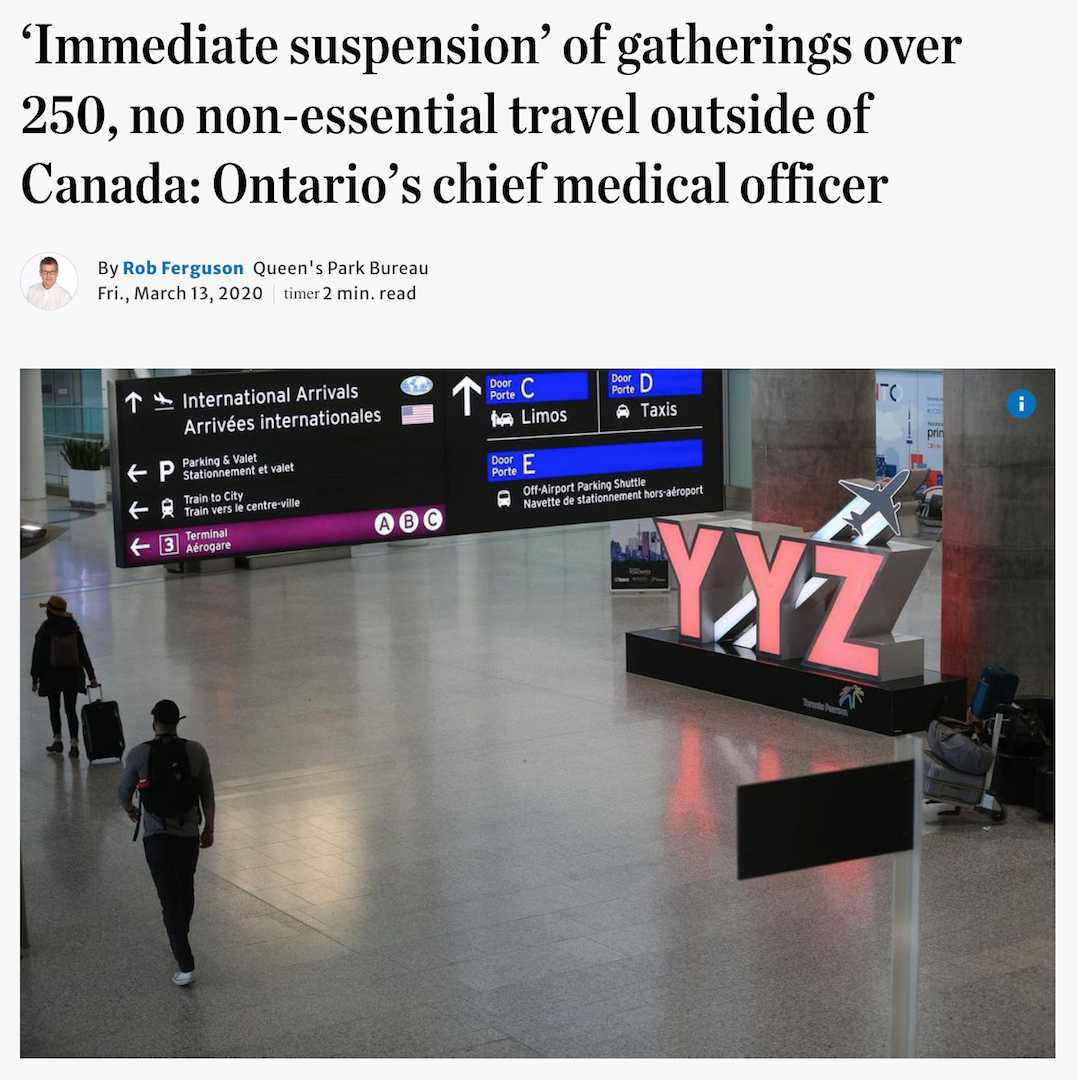
Toronto Star
Many of the students are working parents. Their children will be home for 3 weeks. They may or may not be able to work. I’m certain that there will be stories to tell.


This is a wonderful example of how seamlessly media literacy can be woven into other Language skills. These student are practising reading, writing, listening, speaking as well as thinking critically about the ways that information shifts according to the medium that contains it.